Who doesn't like a good story: DATA
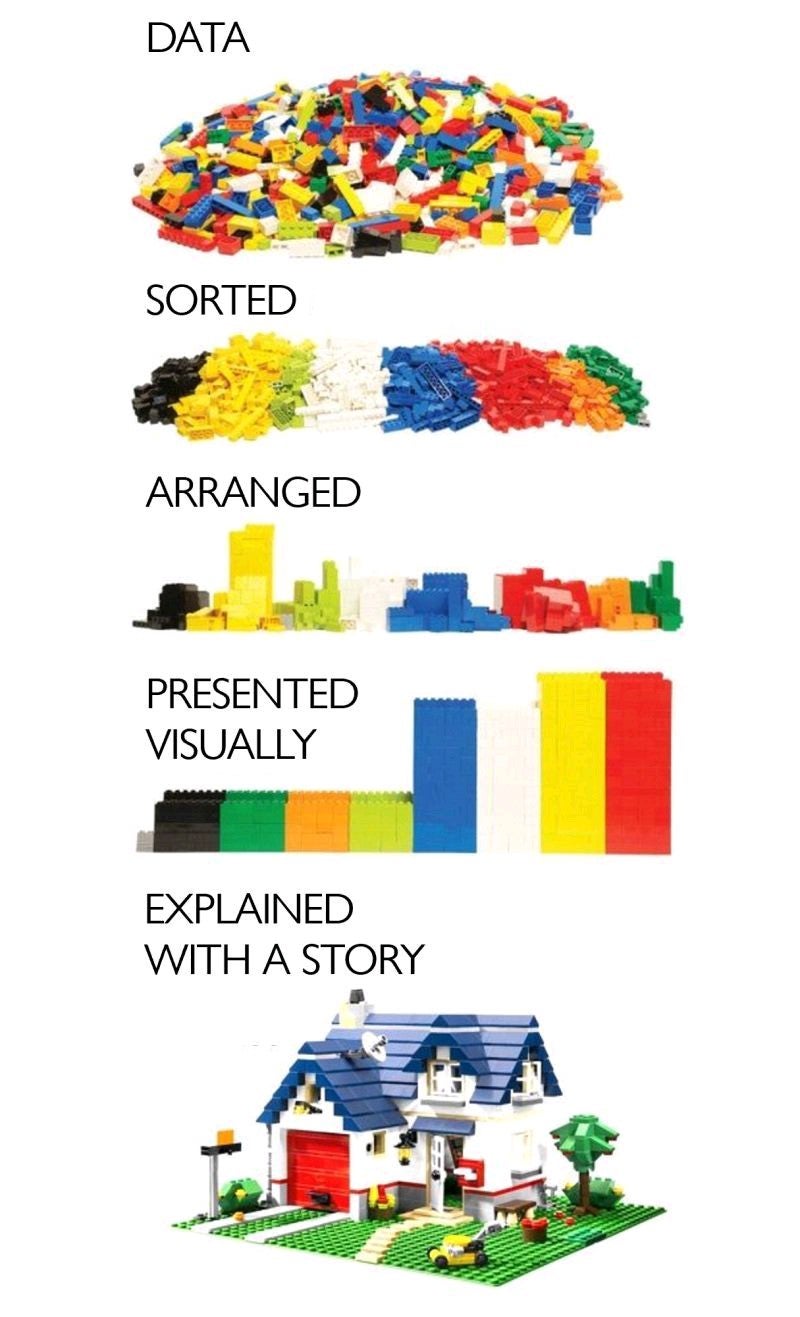
A five-step diagram shows Lego bricks going from a messy pile to sorted colors, arranged rows, a visual bar chart, and finally a small house with a red door and blue roof, labeled "DATA", "SORTED", "ARRANGED", "PRESENTED VISUALLY", "EXPLAINED WITH A STORY"; good for data organization and storytelling.
Text in the image
“DATA” “SORTED” “ARRANGED” “PRESENTED VISUALLY”
Good for
- explaining a data workflow to colleagues
- showing how to wrap data in a story
- training newcomers on charts
Collected from the web · rights belong to the original authorsWeb
- License
- Web collected
- Source
- programmerhumor.io
- Details
- 800×1317 · JPG
Tags
Writing something? Let AI place memes
Paste an article and memes land on the punchlines.


 Works with Claude Code, Codex, Cursor, ChatGPT and 19+ more AI tools→