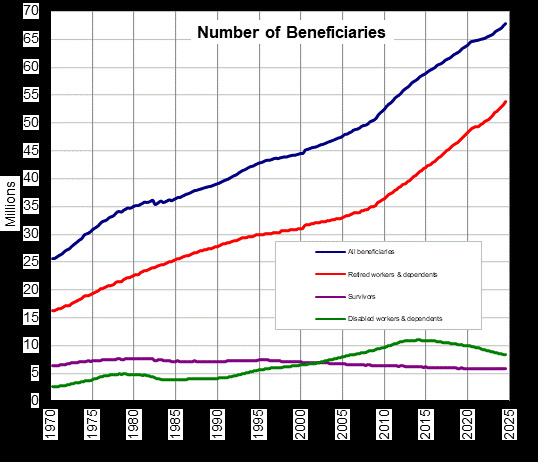
https://www.ssa.gov/oact/progdata/icpGraph.html: Number of Beneficiaries
A line chart titled "Number of Beneficiaries" with a vertical axis in millions and a horizontal axis from 1970 to 2025. The blue line for all beneficiaries rises steadily, the red line for retired workers and dependents follows, while purple and green lines for survivors and disabled workers stay flat. Suitable for showing data growth or trend analysis.
Text in the image
“Number of Beneficiaries” “稳步上升”
Good for
- presenting data growth trends
- explaining long-term chart trends
- discussing beneficiary number changes
Collected from the web · rights belong to the original authorsWeb
- License
- Web collected
- Source
- imgflip.com
- Details
- 538×462 · JPG
Tags
Writing something? Let AI place memes
Paste an article and memes land on the punchlines.


 Works with Claude Code, Codex, Cursor, ChatGPT and 19+ more AI tools→