howDidTheyNaziThat
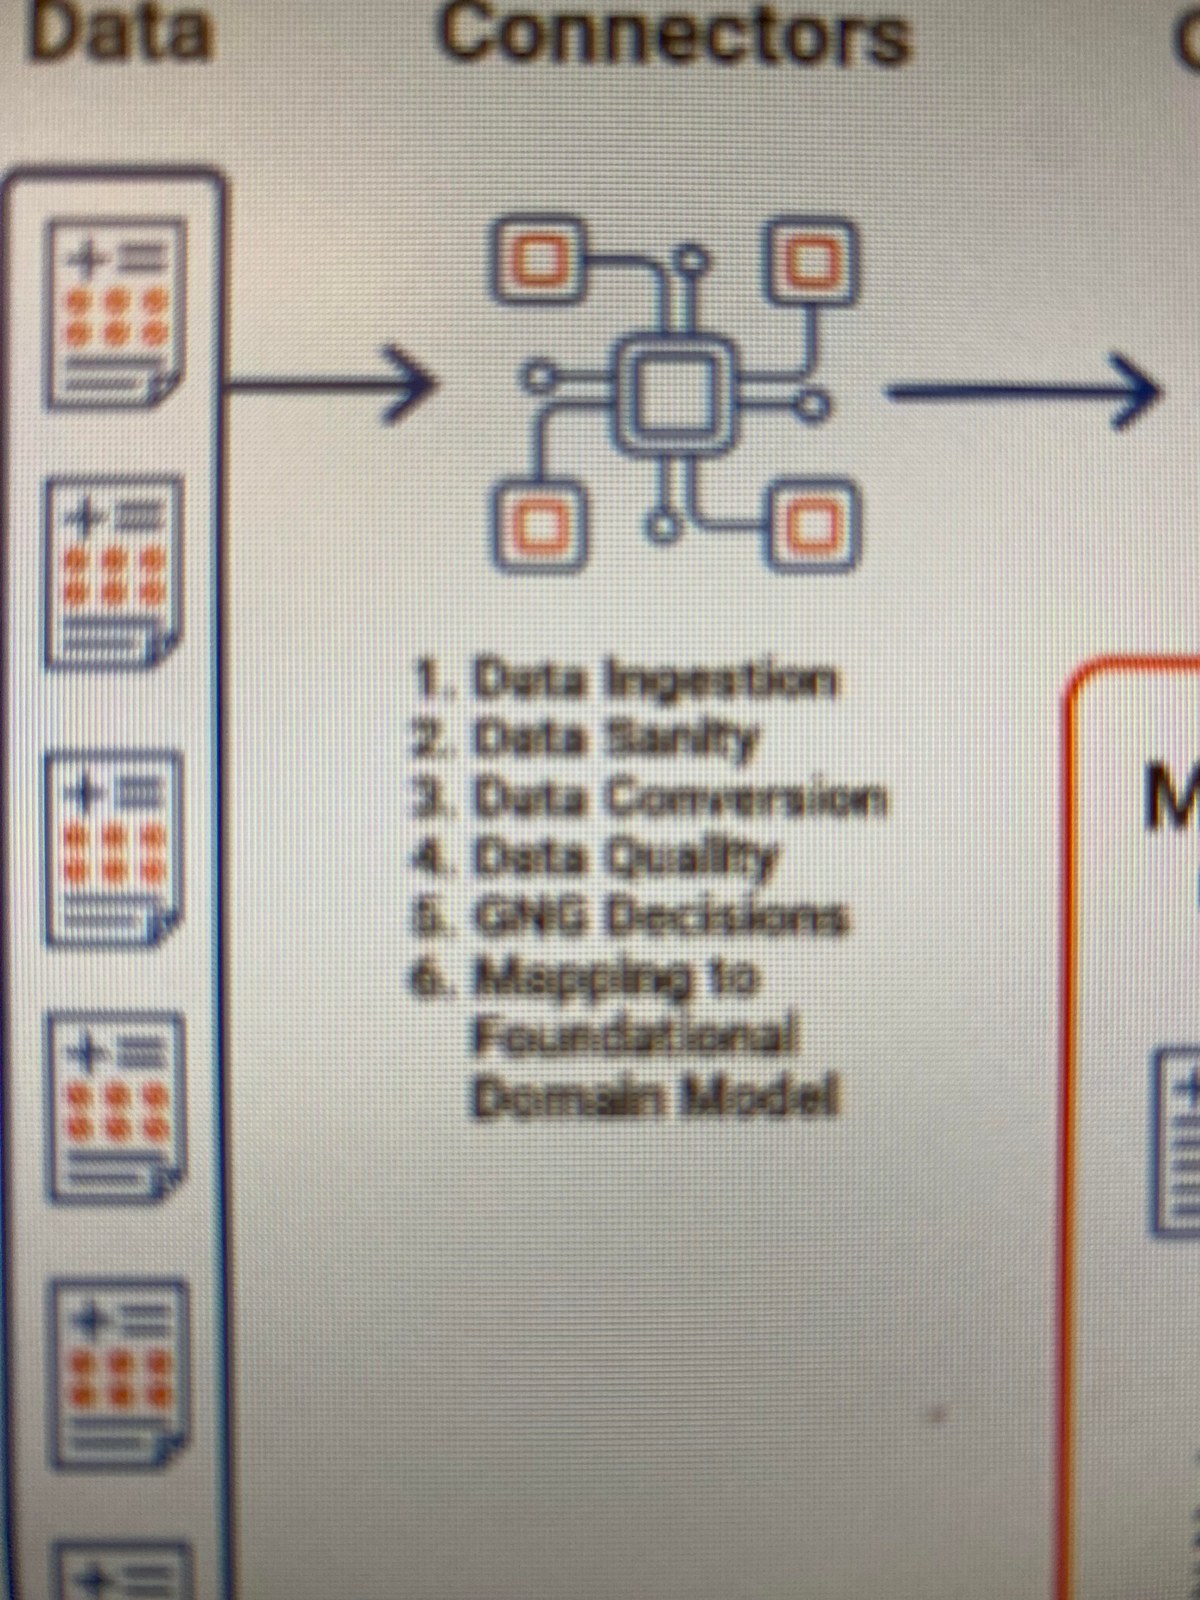
A data architecture diagram with a vertical column of table icons on the left, a central square connector node linked to four small boxes, and a numbered list below covering data ingestion, sanity, conversion, quality, GNG decisions, and mapping to a foundational domain model; suited for technical explanation or workflow overview.
Good for
- explaining a data pipeline to colleagues
- presenting architecture in a design review
- illustrating data governance steps
Collected from the web · rights belong to the original authorsWeb
- License
- Web collected
- Source
- programmerhumor.io
- Details
- 1200×1600 · JPG
Tags
Writing something? Let AI place memes
Paste an article and memes land on the punchlines.


 Works with Claude Code, Codex, Cursor, ChatGPT and 19+ more AI tools→