Flatten The Curve
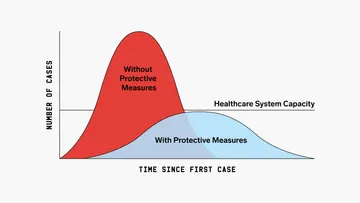
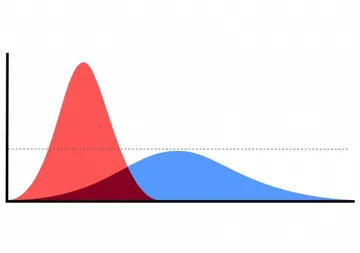
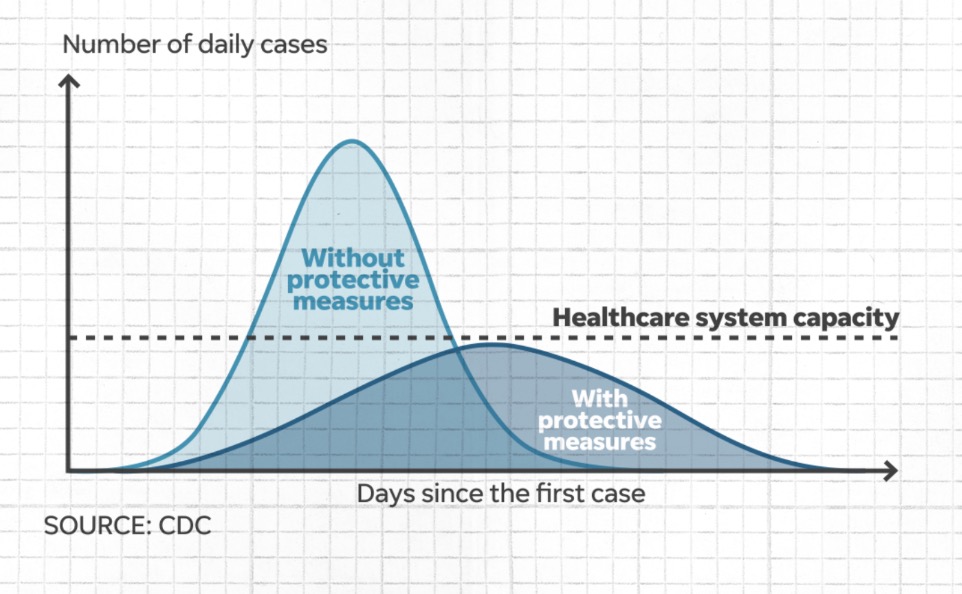
CDC 'flatten the curve' chart: the vertical axis shows number of daily cases, the horizontal axis days since the first case. A steep peak labeled 'Without protective measures' rises above the dashed 'Healthcare system capacity' line, while a flatter curve labeled 'With protective measures' stays below it. Useful for public health and science explanations.
Text in the image
“压平曲线” “Without protective measures” “Healthcare system capacity” “With protective measures”
Good for
- illustrating epidemic prevention in a post
- urging masks and less gathering
- explaining healthcare overload risk
Collected from the web · rights belong to the original authorsWeb
- License
- Web collected
- Source
- imgflip.com
- Details
- 962×594 · JPG
Tags
Writing something? Let AI place memes
Paste an article and memes land on the punchlines.


 Works with Claude Code, Codex, Cursor, ChatGPT and 19+ more AI tools→